


March 5, 2025
Anchor charts are a cornerstone of effective teaching. They’re simple, visual tools that reinforce concepts and help students connect abstract ideas with practical applications. We tend to associate them with literacy instruction but anchor charts are just as valuable in the math classroom. They make complex concepts more accessible, encourage student ownership, and support long-term retention.
In this post, we’ll talk about how anchor charts enhance learning, practical tips for using them effectively, and how Structures of Equality (SoE) anchor charts can support your teaching.
What are anchor charts?
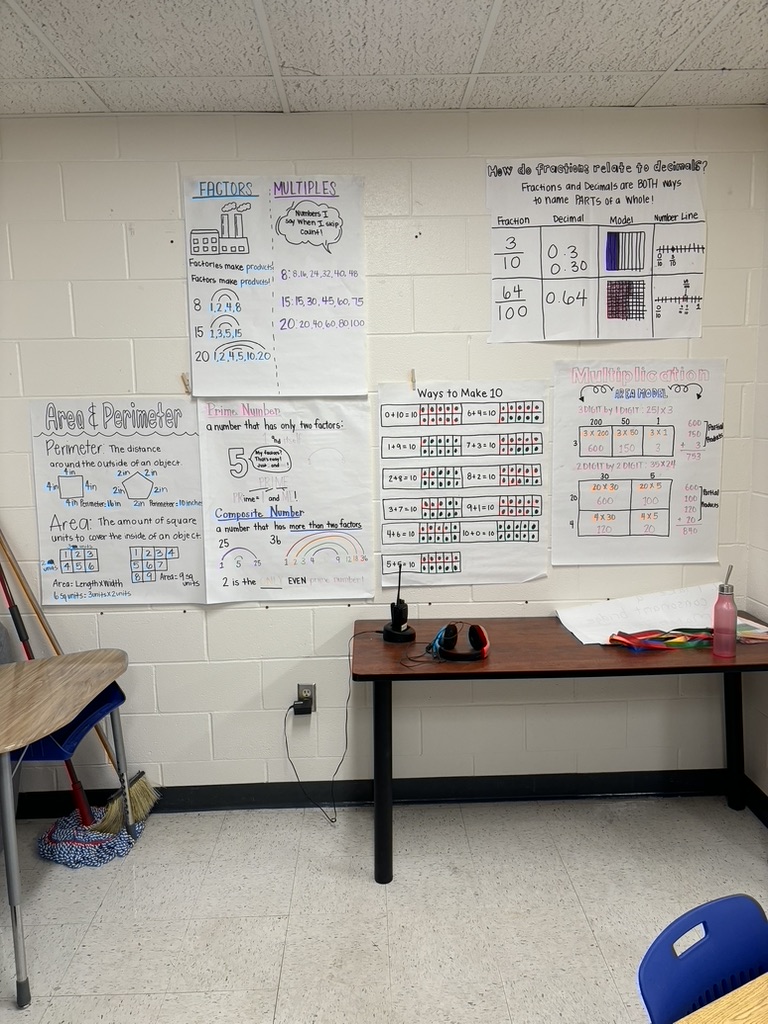
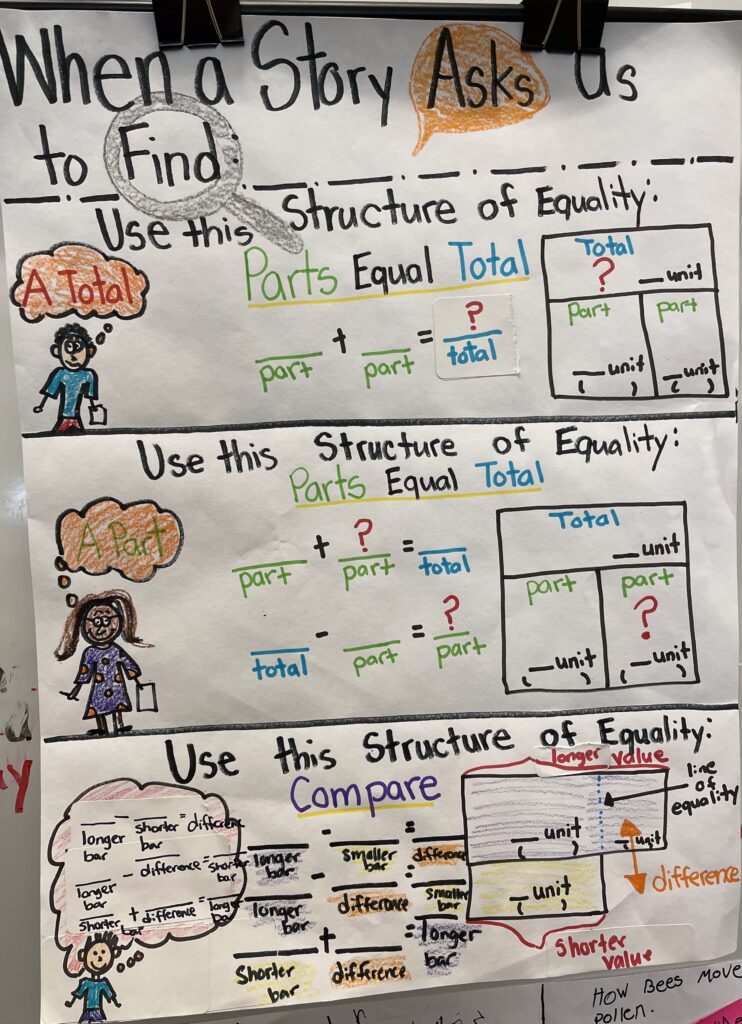
Anchor charts are visual aids created to help students organize and internalize key concepts or processes. They’re a reference point for both teachers and students throughout a lesson or unit. In math, anchor charts break down problem-solving strategies, illustrate structures like Parts Equal Total, and help your students learn vocabulary.
Why anchor charts work:
- Reinforcement. Visual reminders help solidify new learning.
- Independence. Students can rely on charts to guide their thinking without constant teacher input.
- Retention. Even after an anchor chart is removed*, students often recall its information simply by visualizing where it was displayed.
*A concern I’ve heard from teachers is that standardized end-of-year tests require teachers to remove visual displays, like anchor charts. It’s powerful to know students can still reference this information, even when it’s no longer there!
Why use anchor charts in math?
Anchor charts are powerful because they meet the needs of diverse learners. They blend visual, linguistic, and conceptual elements, making math more inclusive and engaging. When used effectively, they:
- Support visual learning. Diagrams, color coding, and clear structures make abstract math ideas more concrete.
- Help with retention. Accurate visuals help students connect with and remember key concepts.
- Empower students. Collaboratively creating anchor charts fosters ownership, so students feel invested in their learning.
Math-specific anchor charts are especially useful for clarifying problem-solving structures and illustrating relationships.
Best practices for creating and using anchor charts
To maximize the impact of anchor charts in math instruction, follow these best practices:
1. Build charts with students
Anchor charts are most effective when created collaboratively. Involve students as you teach a concept or immediately after. Ask for their input, examples, and ideas to include on the chart. This process not only reinforces learning but also encourages ownership. As noted in The Fire & Wire Way, building charts alongside students helps them internalize both the process and the concepts.
When I started teaching, I was always worried about making my charts look pretty and would make them before teaching. Over time, I realized they didn’t have the same impact as when I created them with the students.
2. Keep charts clear and simple
Simplicity is key. Focus on the most important ideas you want students to internalize. Then use large, bold text and student-friendly language. Overloading a chart with information can make it less effective. Visuals, like diagrams and color coding, can help clarify complex ideas. Anchor charts help connect math concepts to real-world scenarios through clear, structured visuals.
3. Make charts accessible
Place anchor charts where students can easily see and use them. Reference the charts often during lessons to show their relevance. Once students have internalized the content, move the chart to a less prominent spot where it’s available for review without dominating classroom space. This way, students who still need to reference them have the ability to do so.
4. Use pre-made anchor charts thoughtfully
The SoE website offers pre-made anchor charts designed for key math structures and strategies. Here’s how to incorporate them effectively:
- Integrate into lessons. Use pre-made charts to introduce or reinforce concepts.
- Adapt for your class. Add examples or annotations to make them relevant to your students.
Encourage regular use. Direct students to refer to charts during independent work or group activities, reinforcing their role as a resource.

You can also use them as a guide to create your own with students. For example, you may want to draw your own SoE Overview poster and add to it as you introduce each structure.
Anchor Chart Checklist
Before creating or using an anchor chart, consider this checklist:
Did you create or adapt it with student input?
- Is the content clear, concise, and visually accessible?
- Does it include visuals or color coding?
- Is it displayed prominently in the classroom?
- Will you reference it regularly to reinforce its use?
- Do you have a plan to move it to a secondary spot once the content is mastered?
Wrapping Up
Anchor charts are an invaluable tool for making math instruction more effective and accessible. Whether you’re creating them collaboratively with your students or using pre-made options from SoE, the goal is the same: provide a clear, visual reference that supports understanding, retention, and independence.
Ready to see the impact of anchor charts in your math classroom? Find our collection of pre-made anchor charts here and start using them in your teaching practice today.